ATLAS Monitoring
A Windows desktop watchdog that answers one question the instant ATLAS is running badly: is this the PC, ATLAS itself, or the data pipeline feeding it?
The problem it solves
When ATLAS lags or stutters mid-session, "is it the PC or is it ATLAS" is normally a guess. This tool watches CPU, RAM, disk, GPU and the ATLAS processes themselves, checks the machine against Motion Applied's own published Minimum/Recommended/Heavy User spec tiers, and turns what it sees into plain-language suggestions. It is a viewer first - the only part of it that writes anything is a handful of one-click optimisations on the Settings tab, each with its own backup-and-restore safety net.
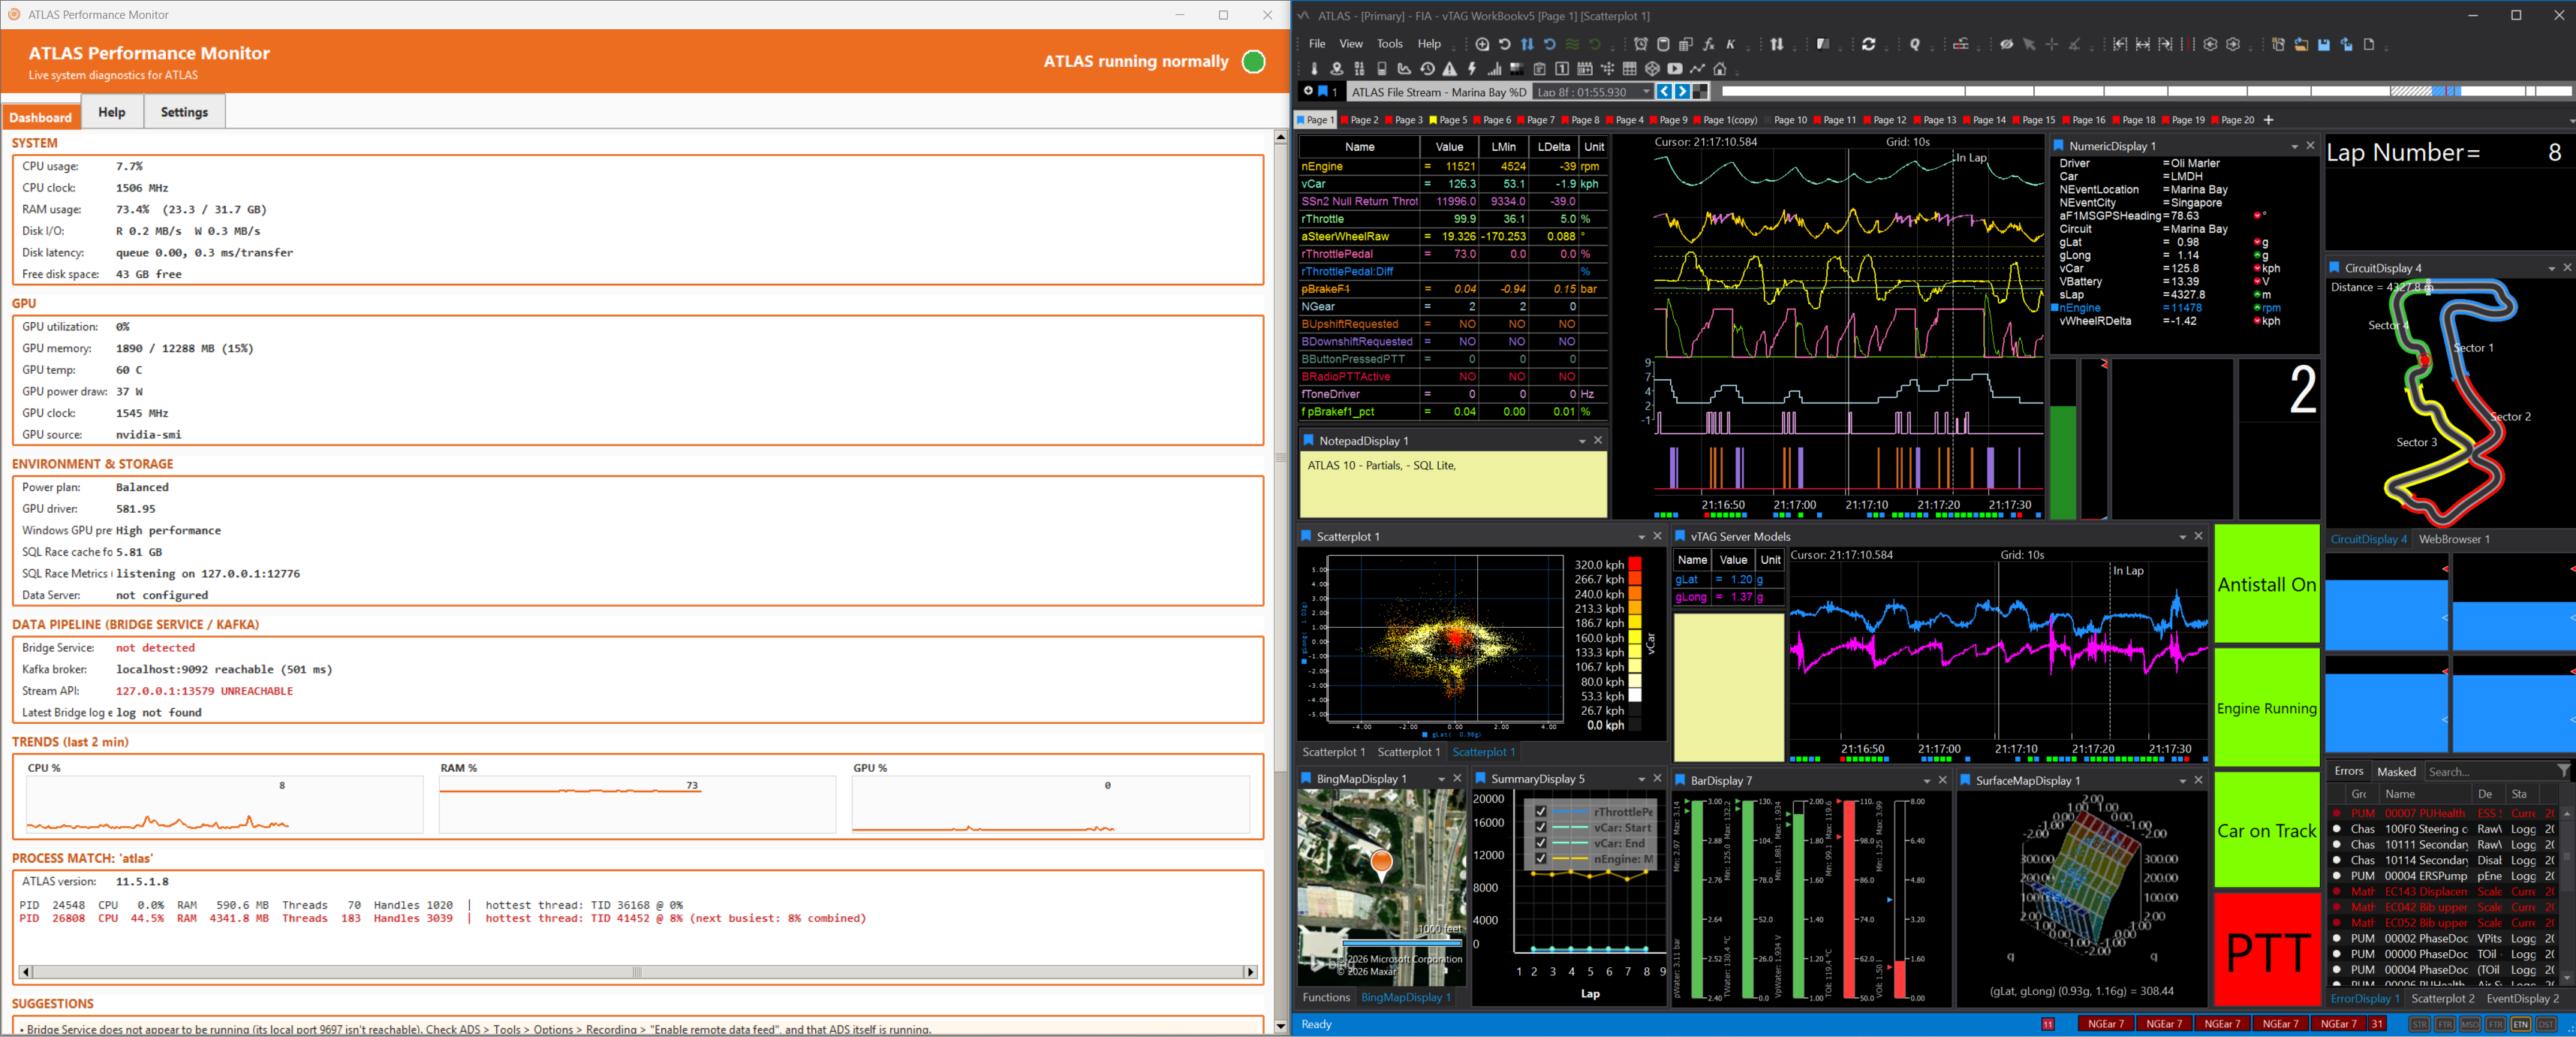
The monitor running live, side by side with ATLAS itself mid-session - this native desktop app really does look like this, not a mockup.
Inside the dashboard
Six panels, each answering one question - together they narrow "ATLAS is running badly" down to a cause.
CPU usage and clock, RAM usage, disk I/O and latency, free disk space - the same basics Task Manager shows, polled without disturbing the machine it's watching.
Utilisation, VRAM, temperature, power draw, clock, and which source answered
(nvidia-smi, WMI, or none) - degrades cleanly on AMD/Intel cards instead of
guessing at numbers that were never available.
Power plan, GPU driver channel, Windows' own per-app GPU preference, SQL Race cache size, and whether a Data Server is configured - the settings that quietly decide whether ATLAS runs well.
Bridge Service, Kafka broker and Stream API reachability, plus the latest Bridge log line - answers whether it's the live telemetry feed itself, not just the PC.
Rolling 2-minute CPU/RAM/GPU sparklines so a spike a moment ago is still visible after it passes, next to per-process detail down to the single hottest ATLAS thread by ID.
Plain-language, synthesised from every panel above - "Bridge Service does not appear to be running" rather than a raw unreachable-port error.
What's involved
Grey/green/red, using the same Windows API Task Manager uses for "(Not Responding)". Red almost always means busy, not crashed - clicking into a blocked ATLAS window queues input and makes the backlog worse, so the tool says so.
HAGS, per-app GPU preference, ATLAS renderer mode, and SQL Race cache sizing can be applied from the Settings tab - each backed by a written-once backup of the original file so a second apply can never destroy the way back.
The column set is decided once logging starts, from a completed set of readings - a machine with no NVIDIA card or no Data Server configured simply doesn't get those columns, rather than carrying empty ones through every row.
Why it's worth trusting
The current release (v17) is a deliberate rewrite of v16 for correctness after real failure modes were found in production use - an unhandled exception could freeze the poll thread while the dashboard kept showing stale numbers looking healthy; an out-of-range setting could spin a CPU core or kill the poll thread outright; a stale Bridge-log error could sit flagged red for a fortnight after it was actually resolved. All three are fixed and covered by the 73-test suite added in the same rewrite, alongside a second discipline the tool holds itself to deliberately: it must not disturb the very machine it's diagnosing, which is why slow operations - subprocess calls, socket checks, filesystem walks - run on their own thread, separate from the live CPU/RAM sampler.
Known limitations are listed openly in the app's own README rather than glossed over - VRAM, GPU temperature and power draw aren't available on AMD/Intel GPUs, multi-GPU machines report only the first card, and the suggestions are rules of thumb, not a replacement for ATLAS's own Performance Profiler.